

🍔AI is Displacing the World
Super Bowl ad spending is a contrarian indicator

Welcome back to MktContext where we explain what’s happening in the US economy, and use that to time the stock market.
The SPX continues to go “violently nowhere” — sharp ups and downs that net out to nothing. Index volatility remains contained, whereas individual stock volatility is at record highs. Over the past month, the SPX is roughly flat and yet the average S&P500 stock moved 10.8%.
Under the hood, there is major dispersion between stocks. As we said last week, the current market is very split. Lots of stocks are at their highs, but simultaneously, lots of stocks are at their lows. Historically, this has preceded major drawdowns.
And yet the US economy continues to chug along. Companies are reporting good earnings. All the pieces are in place for a bull market — we just need the Mag 7 and mega cap tech sector to cooperate.
In today’s note, we’ll discuss what’s happening to different sectors of the market (AI is taking over!) and how the market could progress going forward.
Today’s topics: Jobs, earnings, AI taking over the world, contrarian indicators, technicals, our portfolio.

Jobs plentiful
Positive economic data continued to roll in. This week we got payrolls, unemployment rate, and hourly earnings all surprising positively.
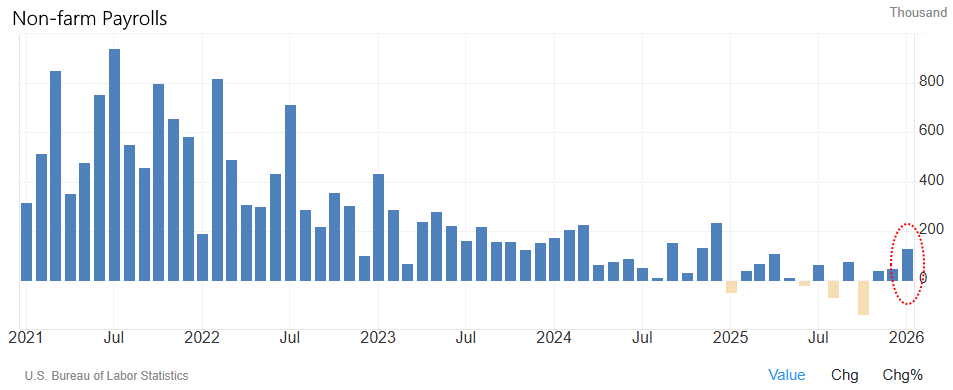
For a long time, the market has been worried about slowing jobs data. But those figures are muddied by changes in labor supply, labor hoarding, immigration cuts, and post-Covid normalization. As a result they have been misleading economists to predict imminent recession, even as the economy proves to be resilient.
A better indicator is Average Hourly Earnings. The logic is simple — this metric captures hourly pay, which employers will cut in a downturn. Instead, AHE has been consistently growing around 0.3% every month. There hasn’t been a single negative print since 2021:

Taking this into account, all of a sudden the whole picture becomes clear: the US economy is currently experiencing a recovery. This is why recession is a very unlikely outcome at the moment.
Unfortunately, good news is bad news as positive economic data means less likelihood for rate cuts. That’s why the market sold off on the news. Rate-cut odds for the entire year 2026 fell sharply, as shown below. But we think the market has it wrong, as Kevin Warsh is likely to cut rates anyway, given his political/economic leanings. We did a deep dive on Warsh here.

For now, the Economic Surprise Index is moving higher, which is what investors want to see to confirm the economic reacceleration thesis. As long as this blue line is moving up and to the right, the economy is getting better and better.

To see our trades and portfolio, consider upgrading to paid subscriber status.
Earnings update
With about 60% of the S&P500 having reported earnings, here’s how the companies are doing. 79% are beating earnings estimates. Earnings are growing 13% from last year, which is astounding velocity. Clearly, the momentum which began in 2023 has continued.
The progression chart below shows the current earnings cycle (thick black line is 2025 Q4). After the lull since April 2025, it has been revised sharply higher in recent months. Needless to say, estimates were too pessimistic in the past year. Of particular note is the 2026 Q4 earnings (magenta line near top of the chart) which shows steady growth in future earnings expectations.

Earnings conference calls have frequently highlighted AI productivity gains and OBBBA tax incentives as primary drivers of growth. Fiscal policy support has been a key tenet of our bullish thesis for this year, and it is working. 2026 and 2027 earnings are now rising 15%, an incredible pace; in the chart below, you can see the estimates inflecting higher:

Lastly, we are seeing positive earnings revisions. This means stock analysts are collectively raising their forecasts for future earnings. It’s a major contributor to stock price movements. Without it, the SPX can’t stay supported and rise higher.

The rest of this article is for premium members. Upgrade now to continue reading:
AI is taking over the world
Contrarian indicators
Technical analysis
Our predictions / how to manage the portfolio in these strange times
Claim your free trial by clicking the button below!
