

Welcome to the free edition of MktContext where we provide a mid-week update. I am a professional money manager, trader, and investor who loves writing about markets. Upgrade now to receive our premium Sunday letter, where we show you how to time the market (yes, it’s possible!).

This week has been a whirlwind. It’s in times like these that having a strong understanding of the macro and an eye for technicals can help us stay calm.
Let’s quickly rehash what has happened in the last few trading days – I won’t bore you with details but if you want me to elaborate, just ask in the comments.
What caused the sell-off?
For most of 2024, investors have been betting on a “soft landing” in the US. And they were correct — the economic datapoints supported this narrative. That is, until last week when manufacturing and labor data sharply deteriorated. There’s a rule in economic circles, called Sahm rule and named after a famous Fed economist, that says any time unemployment rate jumps 0.5% from the lows, that’s a foolproof signal for recession. Overnight, investors became uber concerned that the Fed had already driven this bus off a cliff thanks to their high interest rate policy.
By the way, the debate rages on regarding whether last week’s datapoints are valid. Some say the manufacturing report is contradicted by other manufacturing reports, or that services (restaurants, travel, retail, etc.) are more important. Others say the unemployment numbers were due to temporary layoffs from Hurricane Beryl. Both critiques are sound, but misses the bigger picture: people just NEEDED to sell stocks.
Then there was the Japanese Yen carry trade. You’ve probably read one of the thousands of articles explaining it, but the short version is this: People were levered long QQQ (because, you know, that’s like free money). Some geniuses realized instead of borrowing in USD, they can borrow in Yen for lower interest costs. At the same time, the Yen was depreciating in value so they would eventually repay the loan in less valuable Yens — juicing their returns!
Financial engineering is great when it works. Except, this played out exactly how you would expect it to: in tears. As the Bank of Japan raised interest rates, this spiked the Yen and forced all those levered investors to unwind. That’s the story of how foreign bond markets blew a hole in US stock markets (and a 20% hole in Japan’s stock market too).
Other reasons that contributed to the selloff, less discussed but no less important:
Tech earnings were “meh”, especially for AI capex spend.
Rumors of NVDA’s leading chip facing production delays.
Equity performance in August tends to be seasonally weak.
Hamas political leader Ismail Haniyeh was assassinated by Israel (allegedly). Geopolitical flare-ups risk spiking oil prices, derailing the Fed’s disinflation narrative.
Odds of Kamala Harris winning the presidential election rose to almost 50% — her fiscal policies are believed to be negative for markets.
If you’re enjoying this free post so far, give us a like and restack and don’t forget to share it with someone who loves investing. It really helps us a lot!

What we shared this week
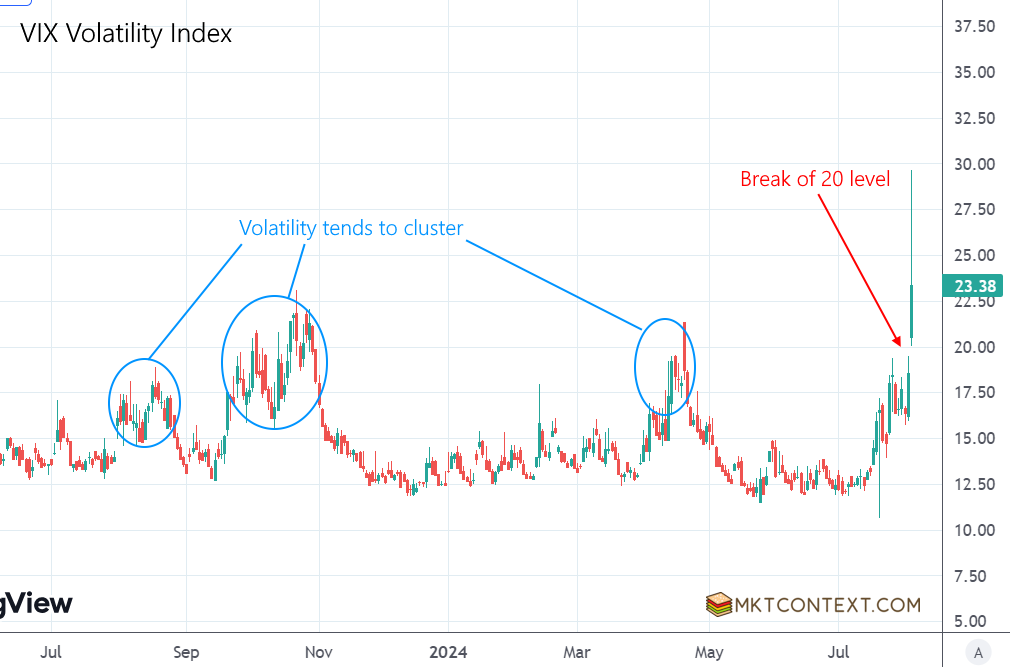
In our paid subscribers’ letter, we sent this chart showing volatility tends to cluster. VIX broke 20 on Friday which marked a new high-volatility regime. High-volatility days rarely show up alone; you usually get at least 5-10 days of it. As such, we predicted more volatility in the coming days and suggested refraining from buying stocks for the time being. That turned out to be prescient as VIX blew out to 65 on Monday morning (!).
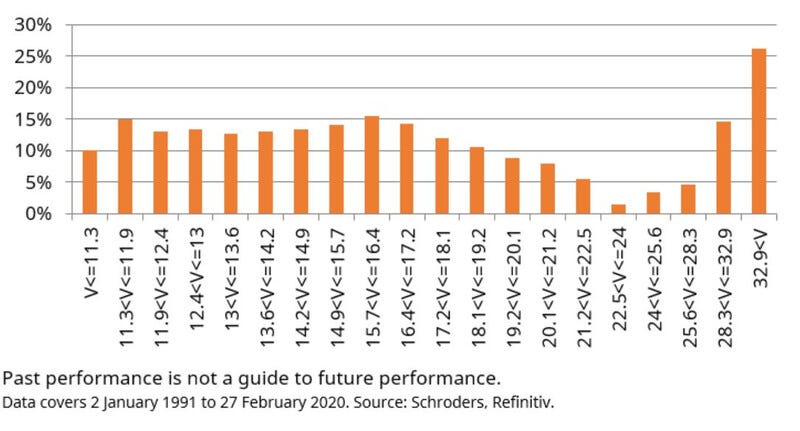
Of course, there’s always a rainbow after the rain: Whenever the VIX rises above 35, forward stock returns tend to be very positive. This is true for the next 3, 6, and 12 months.
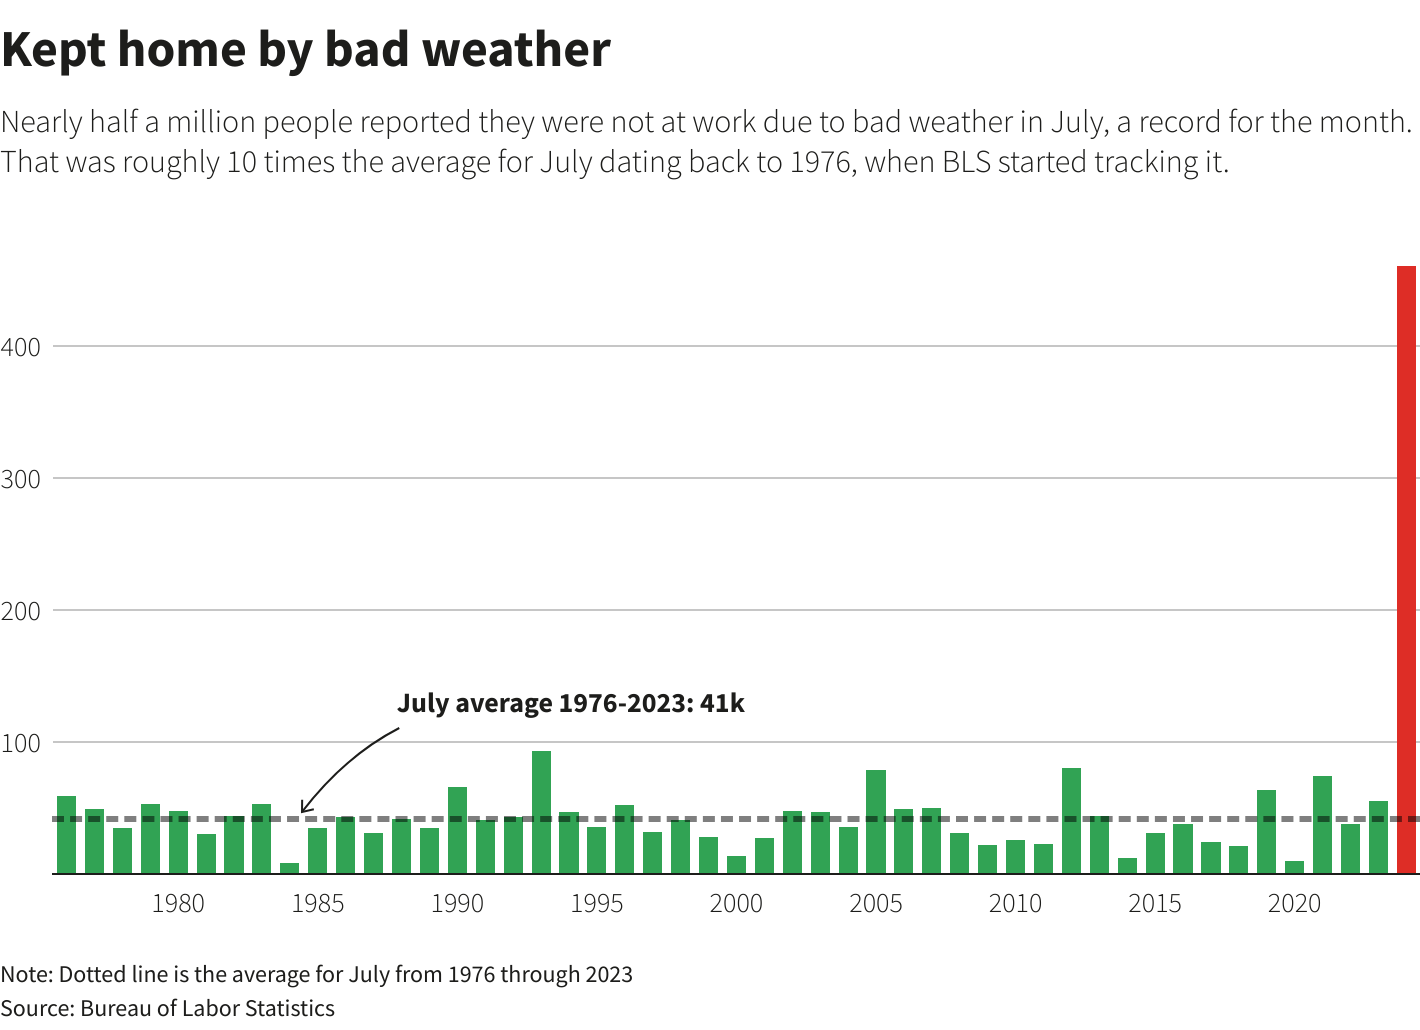
We spent a lot of time debunking the weak jobs report. The spike in temporary layoffs this month was driven by Hurricane Beryl in July. Absent that increase, the unemployment rate would have held at 4.1% instead of 4.3%. Permanent layoffs and part-time jobs (people go part-time to avoid getting fully laid off) still remain at lows. We are simply not seeing the spike in “job losers” that normally spirals into loss of income and fear spreading.
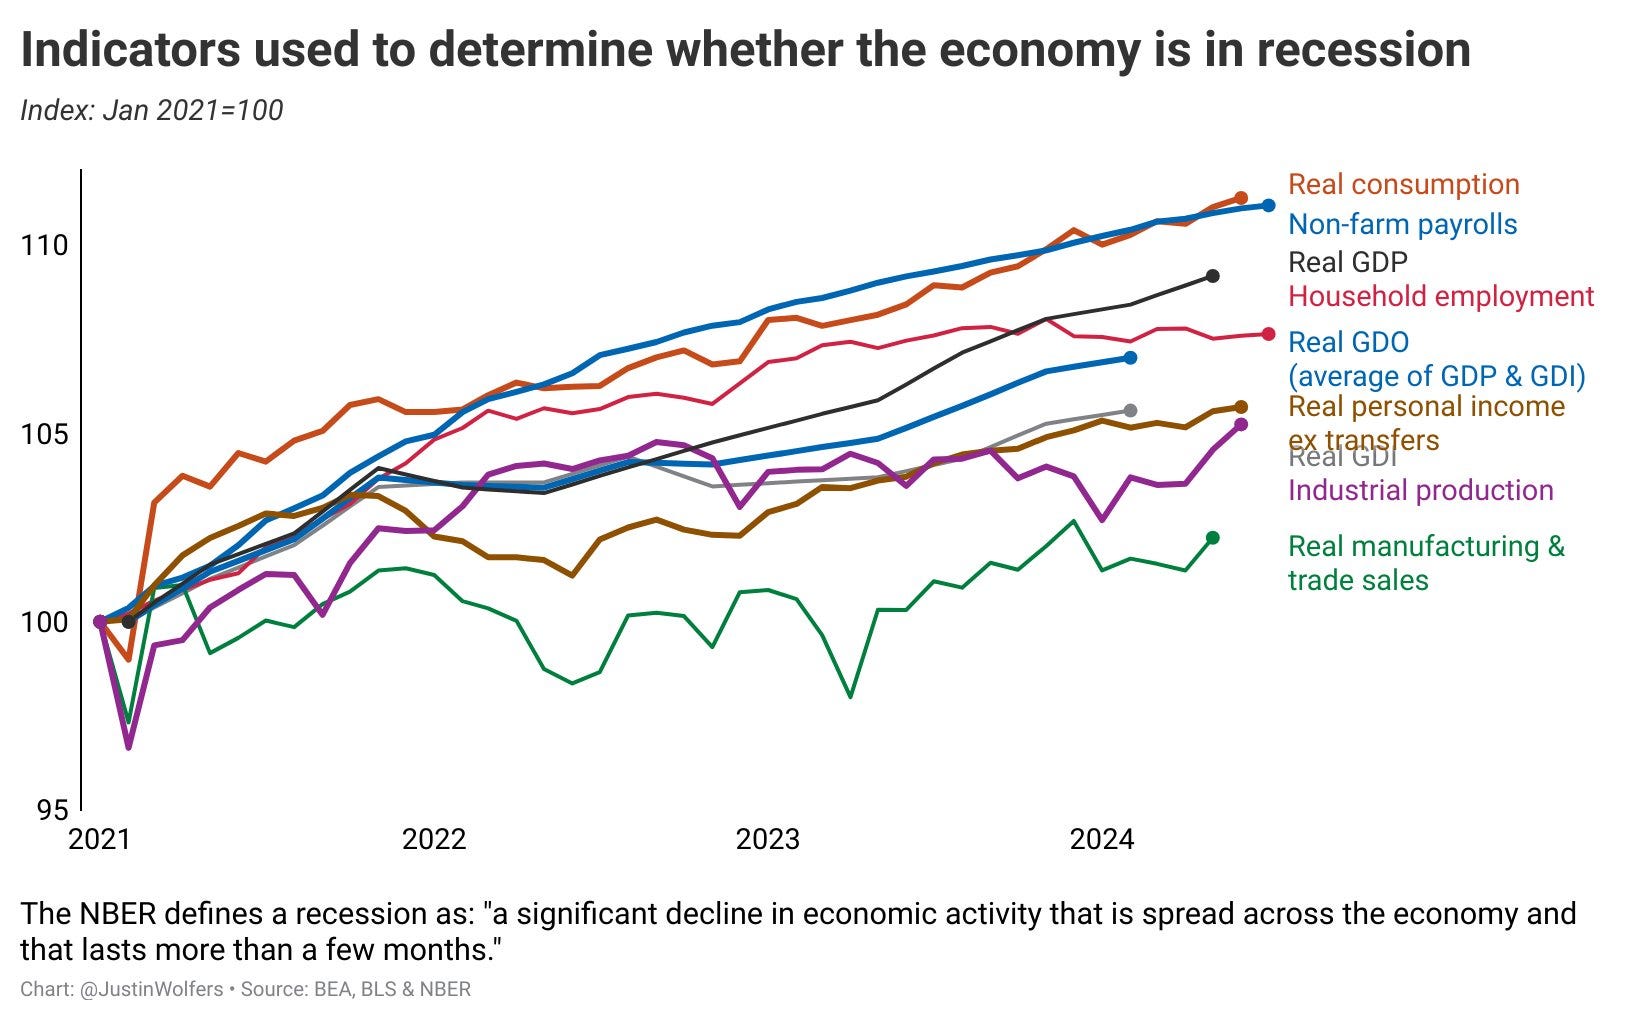
This week, we got more data: real GDP at 2.9%, and Services activity (restaurants, travel, retail, financial services, education, healthcare, etc.) was very healthy. Putting aside the employment and manufacturing figures, other econ data is not rolling over. Therefore we don’t think the economy is headed for a recession, but we do have to temper our enthusiasm for a sharp reacceleration in the economy in the near-term.
In the aftermath of the JPY meltdown, the odds of a 50bp cut in September rose from ~20% to over 80%. This is the market telling the Fed that they waited too long to cut and that we are on the precipice of a recession.
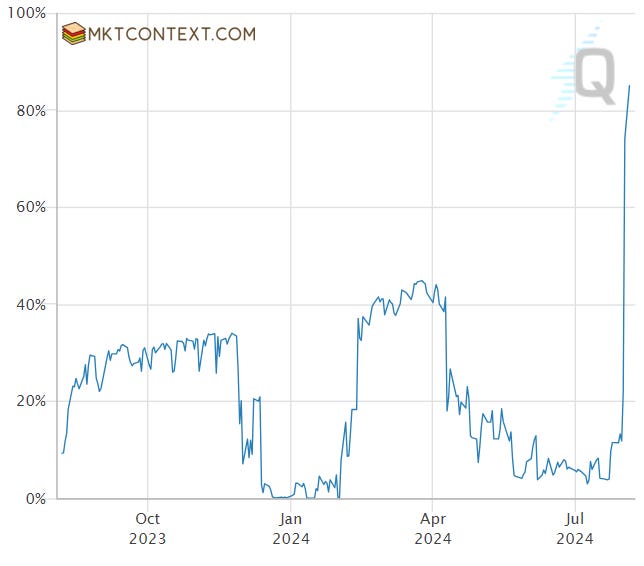

That’s all for today!
If you haven’t already, upgrade to paid tier to get our premium Sunday letter. Learn how we use macro and technical data (like the charts above) to make live, actionable trades that can beat the market.
Disclaimer: This publication is for educational purposes only. The authors are not investment advisors and nothing here is investment advice. Always do your own due diligence.
Is $39 the lowest sub fee for you paid newsletter? Have you done any sale/discount in the past? I like the free updates I have read so far.
A nice overview of what's going on and how you're looking at it.
I've seen a lot of people "blaming" Hurricane Beryl for the unemployment number, but I'm not sure if it's correct. David Mericle, chief economist at GS, specifically quotes the BLS as saying that Hurricane Beryl was "not an issue" with the data.
I've linked the video where he says that below.
I've been trying to get to the bottom of this myself... Curious to hear why you say it WAS an issue, as I try to figure out whether it was or was not.
https://youtu.be/3s11G5o4ENA?si=MqojhGBruGRPM2Yx&t=70