

Editor’s note: This post originally published Oct 9, 2024.
Welcome back. This is the midweek edition of MktContext and I’m a professional money manager who runs a $5B fund. Subscribe to receive our free weekly insights:

As we had anticipated, the markets were poised for a pullback. Two weeks ago we wrote that the put/call ratio had reached an extreme level, and that seasonal volatility was on the horizon. When these conditions materialize, the buying pressure that had been propelling the market higher typically starts to ease up. Consequently, the SPX remained relatively flat over the past two weeks:
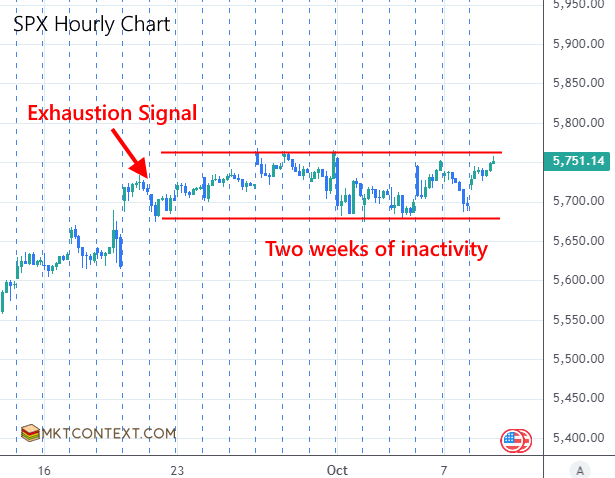
As active investors, we must avoid whipsaw. Effective market timing not only requires the ability to anticipate when a pullback will occur, but also to gauge the likely depth of the correction. This is an inherently imperfect endeavor.
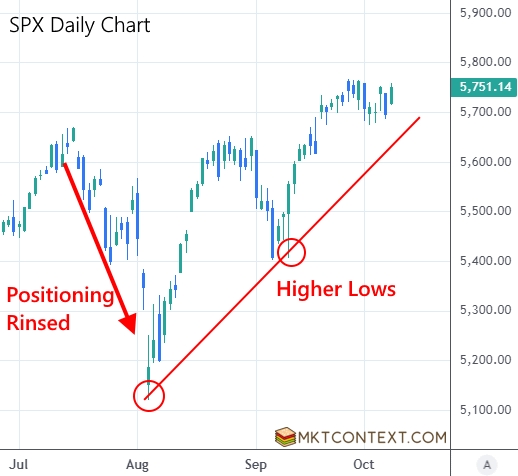
What gave us confidence that the current pullback would be relatively shallow? The underlying macroeconomic and corporate earnings conditions remain supportive of an ongoing market rally. Additionally, the position unwinds witnessed in August and September, coupled with the technical structure of higher daily lows formed since, puts a floor beneath subsequent declines. Absent any external shocks, we were therefore not overly concerned about the prospect of a full-fledged bear market setting in.
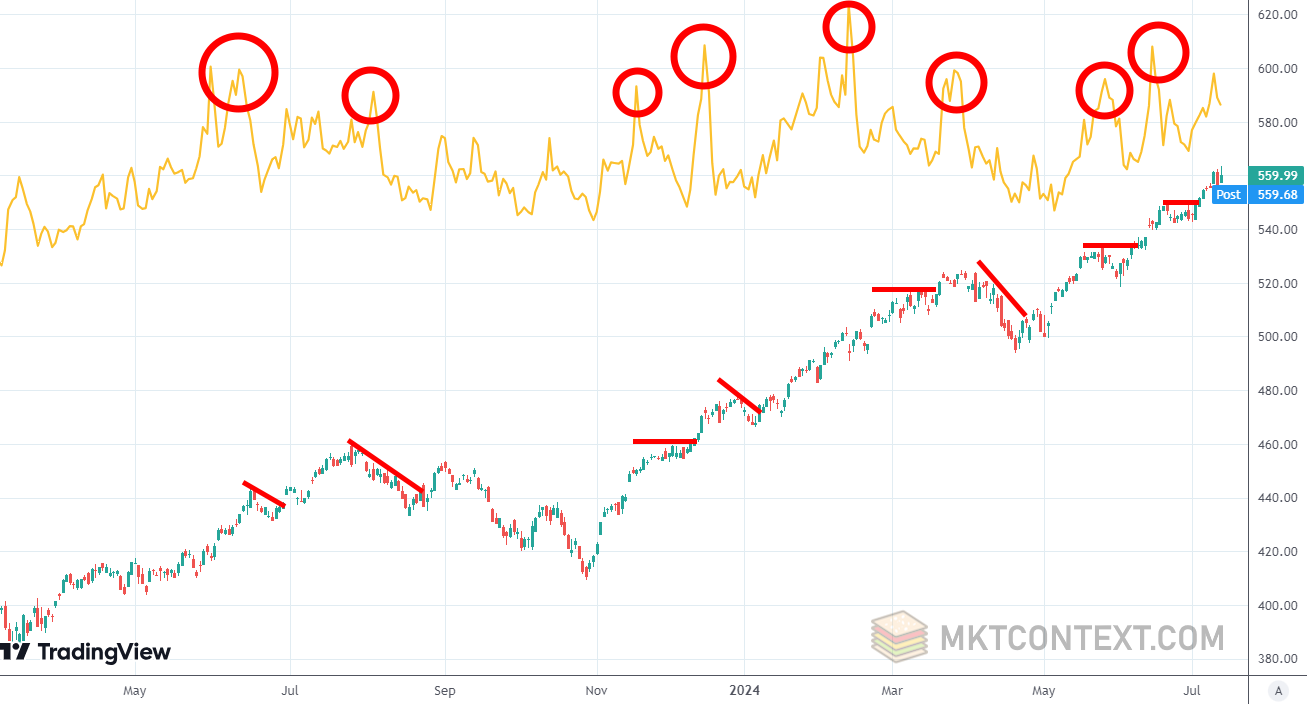
Lastly, don’t forget the Put/Call indicator! Put/call measures the demand for put options in comparison to call options. The former is for downside insurance while the latter is for upside capture. It therefore acts as a sentiment gauge and can be quite timely in marking major market tops.
Share this post with someone who wants to earn money in the stock market:

Macro update
During our recent absence, a flurry of data points was released, with the majority of them corroborating a resilient U.S. economy.
Most notably, the latest jobs report was remarkably strong. Despite the proliferation of recession concerns, the unemployment rate actually declined, job openings rose once again, and even wage growth picked up. Crucially, layoff activity has remained benign, which is a positive sign as layoffs tend to undermine consumer spending.
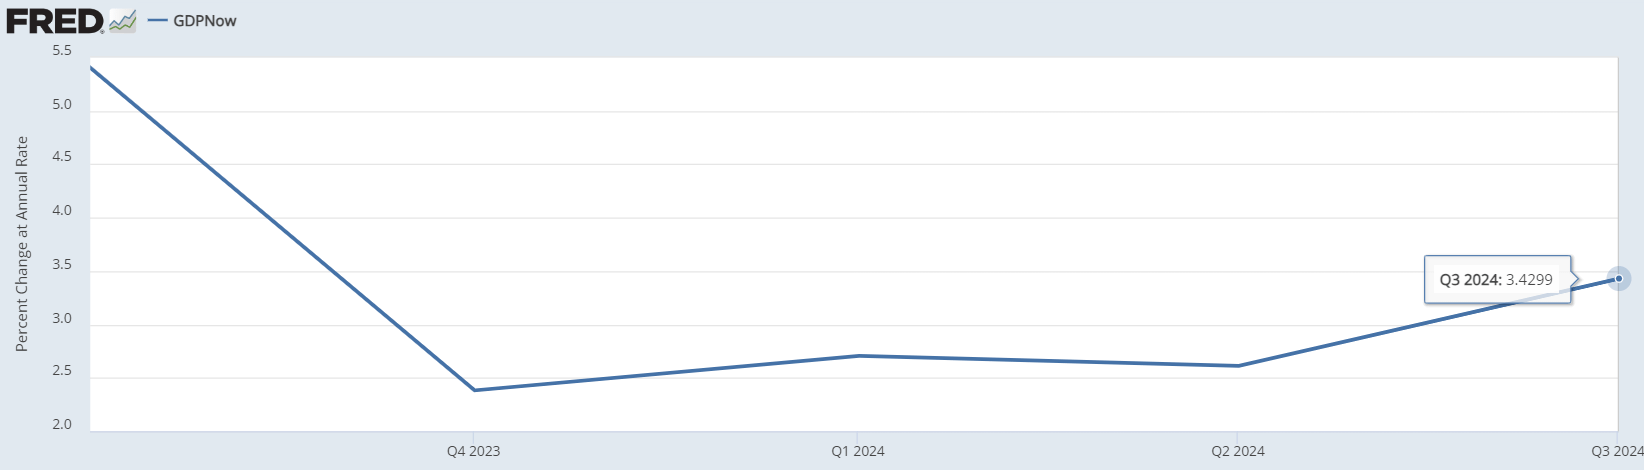
Moreover, the current estimates for real GDP growth in the third quarter are still tracking at around 3% - above the forecasts of many economists. Accounting for an inflation rate of approximately 2%, this translates to a sizable 5% nominal growth rate - a robust figure.
The US economic surprise index has also firmly moved positive:
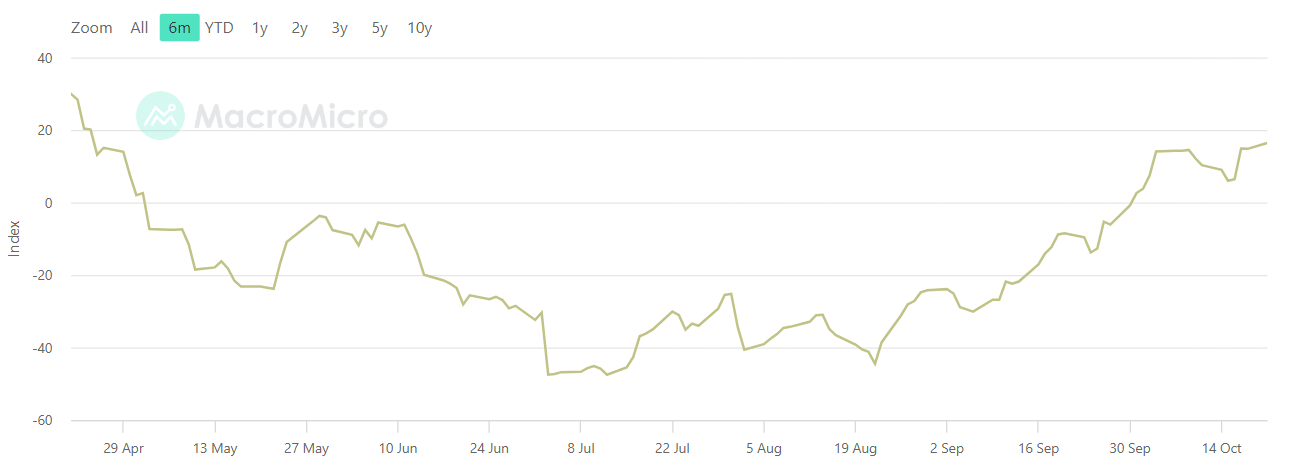
Evidently, the economy is well supported and confirms our bull market call.
Share this post with someone who wants to earn money in the stock market:

Key charts this week
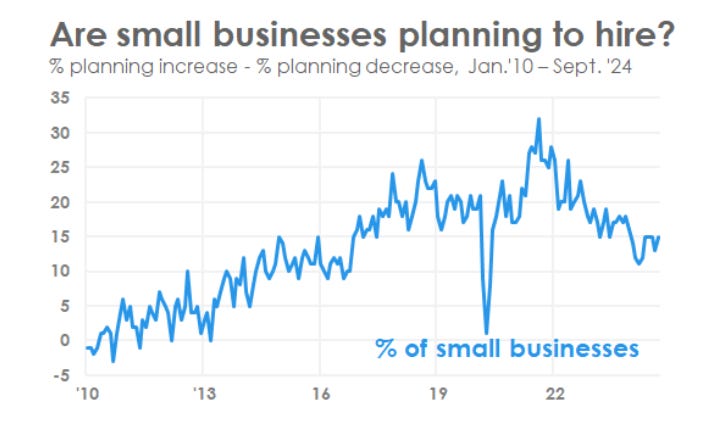
This chart shows small business hiring (rainbow line, inverted) is ticking up, while unemployment edges lower. A sign that the recovery is gaining steam. When corporates are hiring and people are getting back to work, it means more spending power and profits flowing to the bottom line.
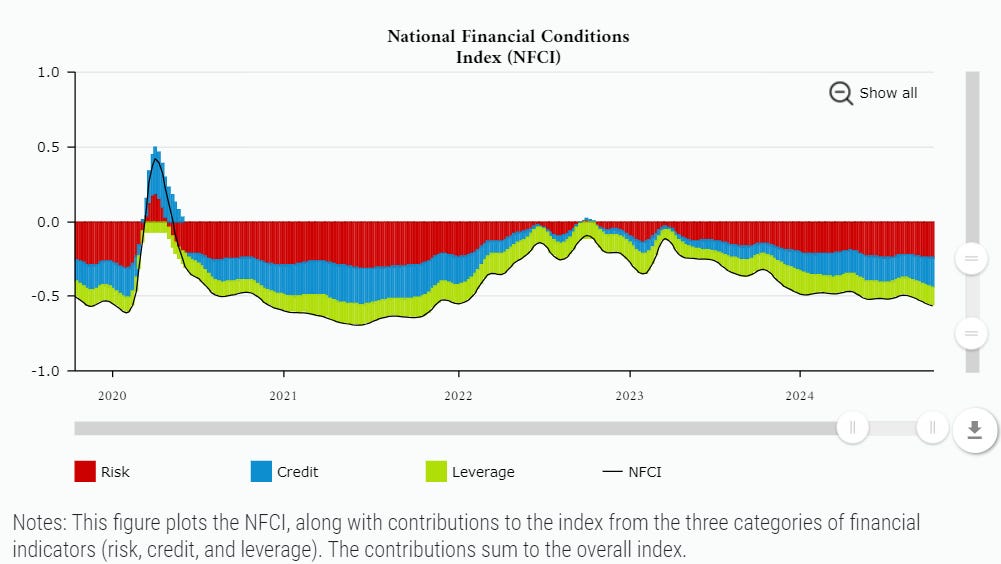
Financial conditions are at the easiest level of this cycle. With credit flowing freely and borrowing costs falling, businesses and consumers can keep this rally roaring. Easier financial conditions act like rocket fuel for stocks, driving corporate investment and consumer spending.
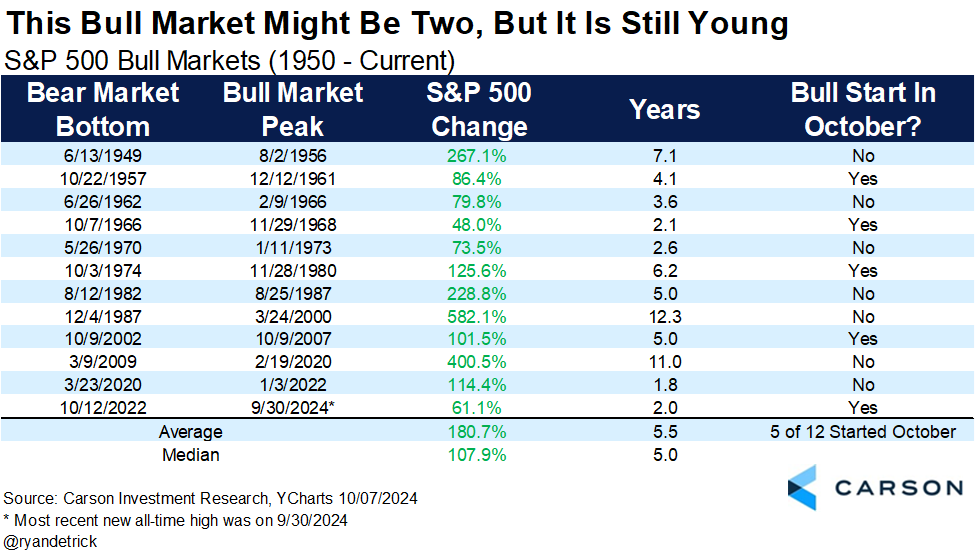
The current bull market is reaching the two-year mark and is up 61%. Compared to the average bull which is up 181% and lasts 5.5 years. We still have a long way to go up! (H/T @RyanDetrick on X)

That’s it for today!
If you liked our content, please subscribe. Our FREE weekly letters will teach you how to use economic data and technical analysis to make money in the market. We’ve been timing the stock market (and beating it) since 2014.
Disclaimer: This publication is for educational purposes only. The authors are not investment advisors and nothing here is investment advice. Always do your own due diligence.