

Welcome to the free midweek edition of MktContext. I am a professional money manager who runs a $5B fund and loves writing about the stock market. Subscribe to receive free weekly insights in your inbox!

Rebound starts
SPX and QQQ rebound in earnest to start the week. We still think last week’s bloodbath was a technical unwind in a low-liquidity seasonal period and not supported by economic data. Be warned, as the next 7 weeks have historically been weak in election years so expect some chop.
Our stop loss came close to triggering but not quite. The 100d moving average supported the SPX. For those who follow intraday timeframes, there is a “higher low” structure being formed, reinforcing the up move. However, no breadth thrust or follow-through day (indicating concerted bullish action) has formed yet. We remain fully invested, awaiting the next signal.

Hard or soft landing?
“The labor market is continuing to soften, but not deteriorate” -Fed Governor Waller
We continue to think we are in a soft landing, but soft landings are hard to track because the deceleration looks similar to a slide into recession. For instance, last week we saw a decelerating payrolls number accompanied by large negative revisions to past data (as discussed here). This week the Challenger jobs report showed a spike in layoffs reminiscent of 2022. Either could be construed as evidence of a soft or hard landing.
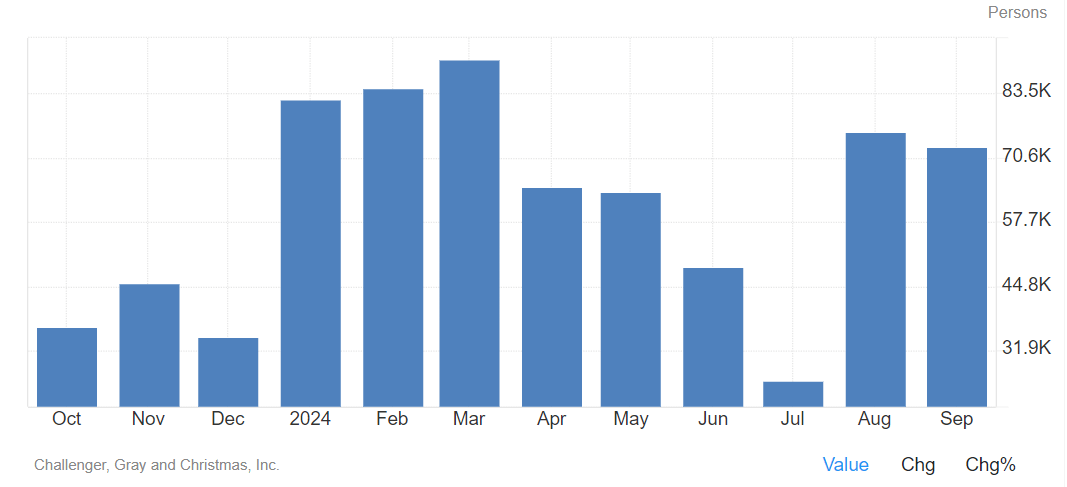
Recessions require a combination of tightening financial conditions (check), an adverse shock (check), and macroeconomic imbalances. We do not see imbalances from excess leverage or extended credit and investment cycles (save perhaps for AI). Therefore there’s no catalyst for a recession.
On the bright side, consumer spending continues at a healthy pace. Income gains have slowed but are still solid, and falling oil prices (now down -25% from Feb highs) should boost household purchasing power in the coming quarter. This argues for a positive economic outcome.

The Cycle’s Not Cycling
Dario Perkins’ interview with Market Huddle perfectly explains the current economic cycle. I’ve adapted some of the salient points of the podcast for this section.
After the economy reopened post-Covid, there was a big shift to spending on services (entertainment, education, healthcare, retail, restaurants, etc). Services require a lot of labor so labor demand came back strongly. Companies couldn’t fill job vacancies and a massive labor shortage ensued. Companies could only add workers as workers became available — mainly from people going back to work and immigration.
Over time the tightness eased; hiring slowed, job vacancies dropped, and wage growth slowed. In a normal cycle, those indicators would signal a recession. This cycle, job vacancies came off because they’d been filled by new workers. That’s not recessionary, but a sign that labor supply is catching up to demand. Once labor demand is satisfied, employment stops rising, which is where we are now.
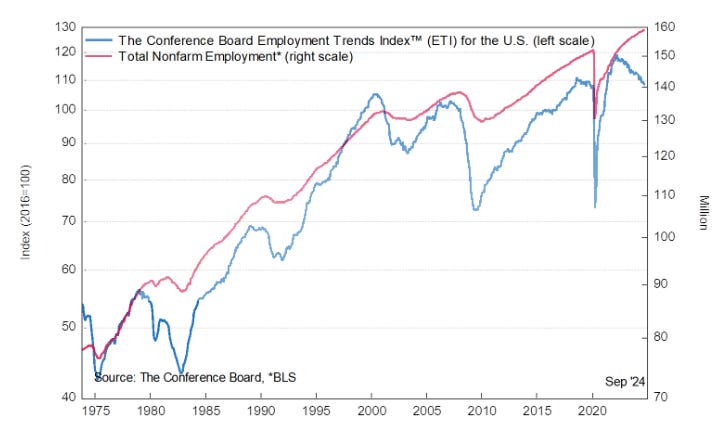
As long as there are labor shortages, you can’t have a recession. Now, compared to two years ago, the shortages are gone so the economy is more vulnerable to a shock.
Earlier we mentioned imbalances — in balance sheets, borrowing, investments. There’s no evidence of any of that. Corporates are in good shape; profits are still going up. Normally you’d get some corporate defaults that trigger the recession. The household is in good shape too; debt is low, income is rising. There’s not massive over-investment anywhere.
The big stimulus from fiscal policy, the inflation associated with that, and the supply chain problems all went away. Thus the recent deterioration in the data is more of a “normalization” than a deterioration. We’re now in a balanced economy, not one where you get deep recessions.

Are interest rates broken?
Why haven’t interest rates worked to slow the economy? There are two transmission channels. The first is credit — high rates stop people from borrowing. This destroys housing transactions, kills demand for durable goods, hurts construction activity, hurts real estate investment. That happened all across the developed world, as expected.
The second part is income effect. Normally you’d expect higher rates to squeeze the incomes of borrowers. Squeeze them hard enough and it eventually causes financial distress. Because they’ve extended the loan maturity, and because there’s been so much de-leveraging, the income mechanism didn’t kick in. So you didn’t get a big squeeze, and no credit event.
Cutting rates will be supportive of the economy. It will have an immediate positive impact on construction, housing, autos, and all the durables purchasing that was hurt by rising rates. It will also help companies dodge the pain of refinancing debt at higher rates. Loosening the belt will help spur economic activity.

Key charts this week
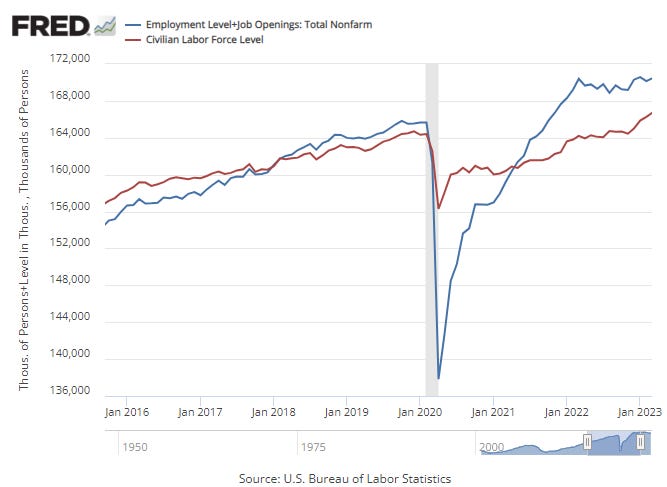
This chart shows the demand for labor (blue line) relative to the available labor supply (red line). As discussed, we have been in a massive labor shortage since 2021 that is only now getting filled. So even though unemployment has been rising, we are still only back to normal levels.
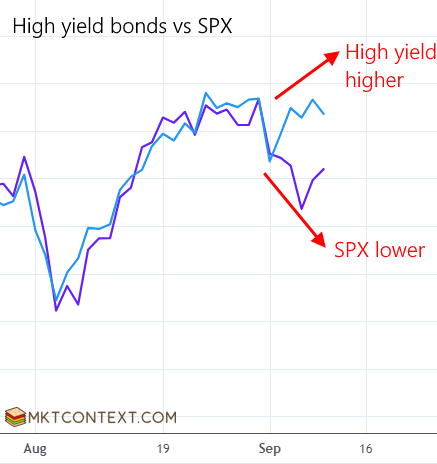
The chart below shows high-yield bonds (HYG, blue line) has stayed expensive as the SPX (purple line) sold off. High yielders are known as “junk” bonds because the borrowers have high default risk. If such companies aren’t struggling to repay debts, there’s no reason why the SPX should be concerned about credit. It is often said that bond investors are one step ahead of equity investors!
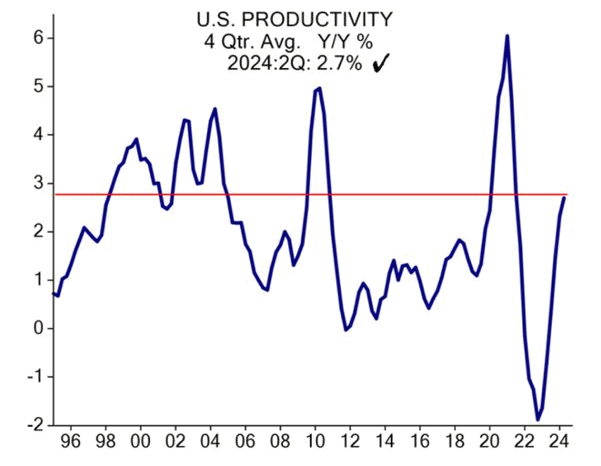
Productivity measures the efficiency of transforming labor/capital inputs into goods and services. It allows more output to be generated without creating inflationary pressures, creating a positive environment for businesses and consumers. Productivity in the US has accelerated to 2.7%. This lowers inflation and lifts corporate profits — another positive for the economy. (H/T @KevRGordon)

That’s it for today!
If you like our content, please click the button below to subscribe. Our FREE weekly letters will teach you how to use economic data and technical analysis to make money in the market. We’ve been timing the stock market (and beating it) since 2014.
Disclaimer: This publication is for educational purposes only. The authors are not investment advisors and nothing here is investment advice. Always do your own due diligence.
Nice chart and interesting divergence between the high yield bonds and the SPX. It will be interesting to see which one of these reverts back to the other.