

Hi all, MktContext here. From time to time we look for awesome Substack authors to share their investing ideas with you. This post from Lars Von Thienen is a deep dive on market cycles and P/E ratios. He uses mathematical theory to detect repetition or “cycles” in the market, and it suggests we’re about to fall off a cliff!


Are US stocks on top of a cliff?
I recently analyzed the price-to-earnings (P/E) ratio of the S&P 500 stocks, focusing on the Cyclically Adjusted P/E ratio. The CAPE or Shiller P/E is a widely used valuation metric that helps investors determine whether the market is overvalued or undervalued based on historical earnings. As of the time of writing, the CAPE ratio stands at a very high level of 38.88.
Do we see cyclical patterns in the P/E ratio that could explain the fluctuations between high and low price-to-earnings ratios? This could be a common pattern where the US stock market's over- and undervaluation occurs in more rhythmic ups and downs instead of erratic high or low valuations.
The baseline data
The cycle analysis revealed fascinating results which I like to share with you. We will use the S&P500 P/E ratio starting 1900, using 120 years of monthly data.


The Cliff
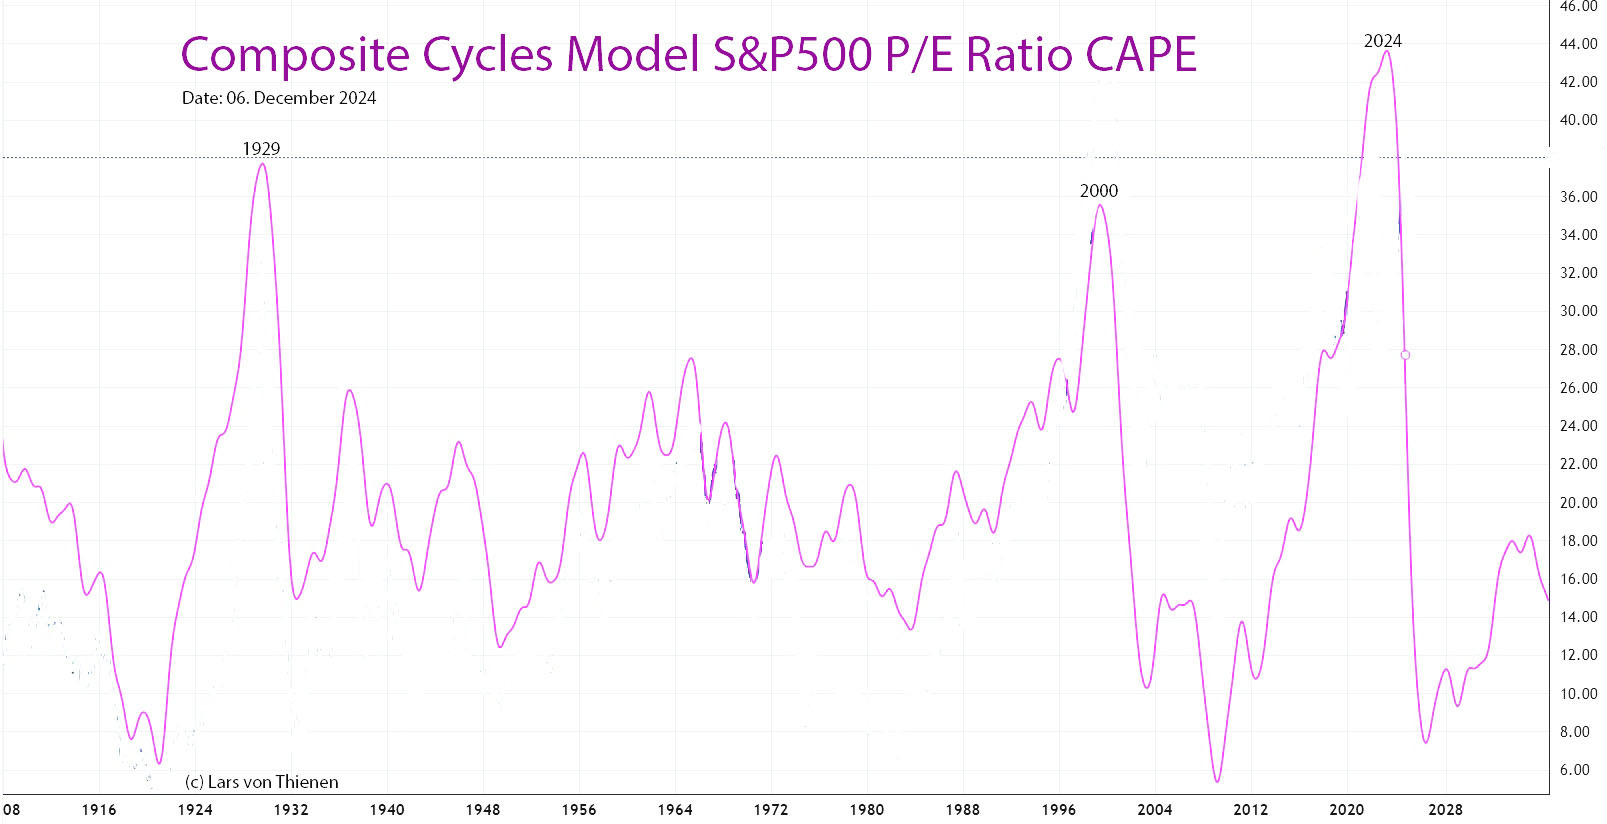
The chart below depicts a composite model of all identified cycles in the P/E Shiller data from 1900-2024. Notably, the "cliff" phenomenon, where all cycles synchronize their peaks at a single point in time, has only occurred in 1929, 2000, and now appears to be happening again in 2024. This means that the underlying cycles of the PE ratio have synchronized their peaks twice before, in 1929 and 2000, leading to sharp drops in stock market prices. It is intriguing to see this top synchronization occurring once more, as it suggests a potential synchronized market decline at the end of 2024.
The cliff refers to the synchronization of all identified cycles into their downward phase, which creates a visually striking "cliff-like" shape in the composite plot of these cycles.
The cycle scanner table shows that all the identified cycles are currently in the downward phase, indicated by the red background behind the cycle length numbers. This is a very rare situation, as normally you would see a mix of cycles with red, yellow, and green backgrounds, with some cycles pointing up and others pointing down. The fact that all cycles are pointing down is an unusual and noteworthy observation.


The 42-month cycle
Another key observation is the cycle at the top of the table. The 42-month cycle has the highest strength and is the dominant cycle in the dataset. This 42-month cycle is generally significant for financial markets, as it has been identified across numerous financial assets. Let's take a closer look at what makes this cycle so special in this case.
Starting with the current situation, the 42-month cycle has topped at major market peaks, such as the internet bubble in 2000, the financial crisis in 2007, and 2021. Additionally, the bottoms of this cycle have been synchronized.

At the bottom of the chart, there is a "cycle-highlighter" that shows the theoretical 42-month cycle in red. The light blue line represents the actual cyclic behavior of the P/E ratio over that 42-month period. When the red and light blue lines move in sync, it indicates a strong correlation and cyclical pattern in the P/E ratio according to the 42-month cycle.
Furthermore, looking back to 1900, the same stable 42-month cycle can be observed in sync with the ups and downs of the P/E ratio over the past 120 years.

A cycle that remains remarkably stable in length and phase over 120 years is quite uncommon. As shown in the upper chart, the 42-month cycle is also currently reaching its peak and transitioning into a downward phase, which is expected to continue into 2026.

Summary
This is a highly unusual situation where all the identified cycles in the S&P 500 P/E ratio have synchronized and are now in a downward phase. This rare event has only occurred twice before, in 1929 and 2000, and led to significant market declines.
Disclaimer: This publication is for educational purposes only. The authors are not investment advisors and nothing here is investment advice. Always do your own due diligence.