🍔First Sell Signal TRIGGERED
Here's what to do next...
Welcome back Investors,
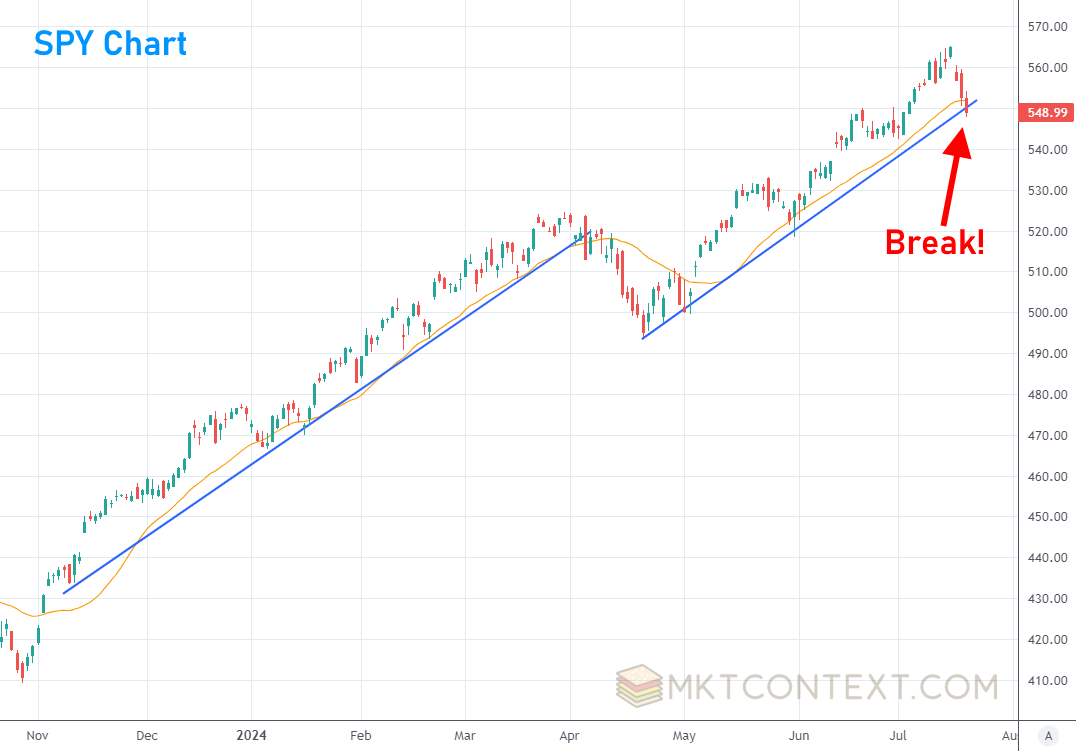
The SPX is down -3% from its high on Tuesday. In the subscribers-only section of our last two posts “Thesis Confirmed! Growth is Coming” and “Unstoppable Force: Bull Run Far From Over” we showed how we predicted the mkt selloff this week - that’s exactly what happened. Today we discuss what to do now that the sell signal is activated (hint: not as simple as selling!)
Before we dive in, please help us grow by liking this post on Twitter @mktcontext and sharing with an investor you know! It really helps a lot :)
What’s causing this selloff?
The kindling was set last week with the rotation from large caps to small caps. The match was lit when ASML (Dutch chip equipment maker) reported restrictions being placed on them and AMD reported their chips overheating. This dragged down the whole semis complex including NVDA (where NVDA goes, so goes the mkt). The fire has now spread to other parts of tech like META and AMZN.
But fundamentals are only half the story. The technicals added gasoline to the kindling while no one was looking! The technicals told us that tech was overbought and extremely crowded. So while we were happy to keep riding the AI hype train, we also kept one eye on the exit in case things went south. Now that that has occurred, let’s talk about how we should position…
Sell signal triggered! What do we do now?
The break tells us the up trend could be ending. It’s not a 100% guarantee, which is why I will only be selling 30% of my stocks and monitoring how the mkt reacts over the next few days. There are two main scenarios that are possible: 1) it retests the trendline before going down; and 2) it bounces straight up.
The first scenario would be normal action for a continuation down. Note that it can also just go straight down without “retesting” the trend line. The reason it retests is because buyers are step in on at lower prices, only to be overwhelmed by sellers again. That is a key sign of downward pressure to come. We will then sell more at the break of the 50d moving average line and go from there.
The rest of this article is for paid subscribers only. Subscribe now (free trials available!) to continue reading today’s topics:
Two scenarios could play out from here
Is this the dip to buy?
Health of the small cap rally
Should you be buying IWM now?
Sectors have completely changed!
Keep reading with a 7-day free trial
Subscribe to MKTCONTEXT to keep reading this post and get 7 days of free access to the full post archives.


